[ad_1]
If you’re looking for a real-time server monitoring tool, Netdata gives you plenty of information with a simple installation.

Every IT pro knows that data is key to keeping things running smoothly. To that end, you need tools that can monitor usages such as CPU, RAM, load, Swap, bandwidth, disks and more. You might think getting a tool like that up and running would be a bit of a challenge. However, if Ubuntu Server is your platform of choice, adding this powerful web-based monitor is incredibly easy.
SEE: 40+ open source and Linux terms you need to know (TechRepublic Premium)
Netdata offers plenty of features to help you troubleshoot a litany of problems with single-second granularity, real-time visualization, ML-powered anomaly detection, root cause analysis, built-in data privacy, data snapshot export and import, and more.
I’m going to walk you through the process of deploying Netdata to Ubuntu Server 22.04 and Rocky Linux. You can also deploy Netdata with Docker, but the capabilities, such as host OS performance and status, are limited. Because of that limitation, your best bet is to install Netdata directly on the host.
What you’ll need to install Netdata on Linux
To successfully install Netdata you’ll need a running instance of Linux. I’m going to demonstrate on both Ubuntu Server 22.04 and Rocky Linux 8. You’ll also need a user with sudo privileges.
How to install Netdata on Ubuntu Server 22.04
Log in to your Ubuntu Server 22.04 instance and install Netdata with the command:
sudo apt-get install netdata -y
Start and enable the service with the command:
sudo systemctl enable --now netdata
Open the necessary firewall port with the command:
sudo ufw allow 19999
That’s it for the installation on Ubuntu Server 22.04. I told you it was simple.
How to install Netdata on Rocky Linux 9
Log in to your Rocky Linux 9 instance and install the EPEL repository with the command:
sudo dnf install epel-release -y
Install Netdata with:
sudo dnf install netdata -y
Start and enable the service with the command:
sudo systemctl enable --now netdata
Open the necessary firewall ports with the commands:
sudo firewall-cmd --permanent --add-port=19999/tcpsudo firewall-cmd --reload
How to configure Netdata
By default Netdata is only accessible from the IP address 127.0.0.1. To make it accessible from any machine on your LAN, open the configuration file with:
sudo nano /etc/netdata/netdata.conf
In that file, look for the line:
bind socket to IP = 127.0.0.1
Change 127.0.0.1 to the IP address of your hosting server. Save and close the file. Restart Netdata with:
sudo systemctl restart netdata
How to access the Netdata web UI
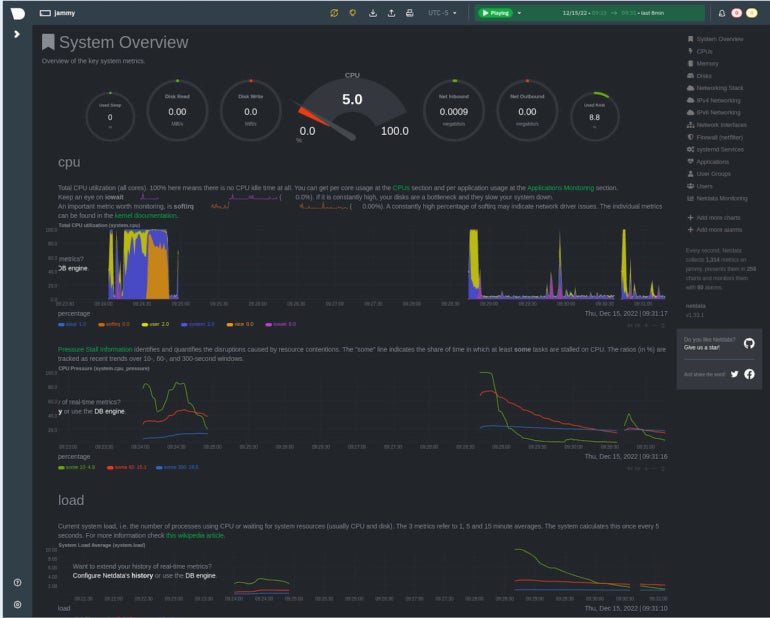
With Netdata up and running, open a web browser and point it to http://SERVER:19999. You should immediately find yourself on the Netdata dashboard (Figure A), where you can start monitoring your system.
Figure A
An outstanding solution
Any admin who needs to keep watch on how a server is performing should seriously consider installing Netdata. At the free price point, you’d be hard-pressed to find an easy, more robust solution. The only caveat to Netdata is that it only watches one server, so you cannot monitor more than one node. If you need to monitor numerous machines from one interface, you can always give Netdata Cloud a try.
Subscribe to TechRepublic’s How To Make Tech Work on YouTube for all the latest tech advice for business pros from Jack Wallen.
[ad_2]
Source link